
Delhi AQI After Diwali: 255 Pollution Readings Missing, Study Flags 49% Gap—What Went Wrong?
Missing pollution readings raise fresh questions about Delhi's post-Diwali air-quality reporting.
 IN
Thu, Nov 12, 2026 | 03:09 PM IST


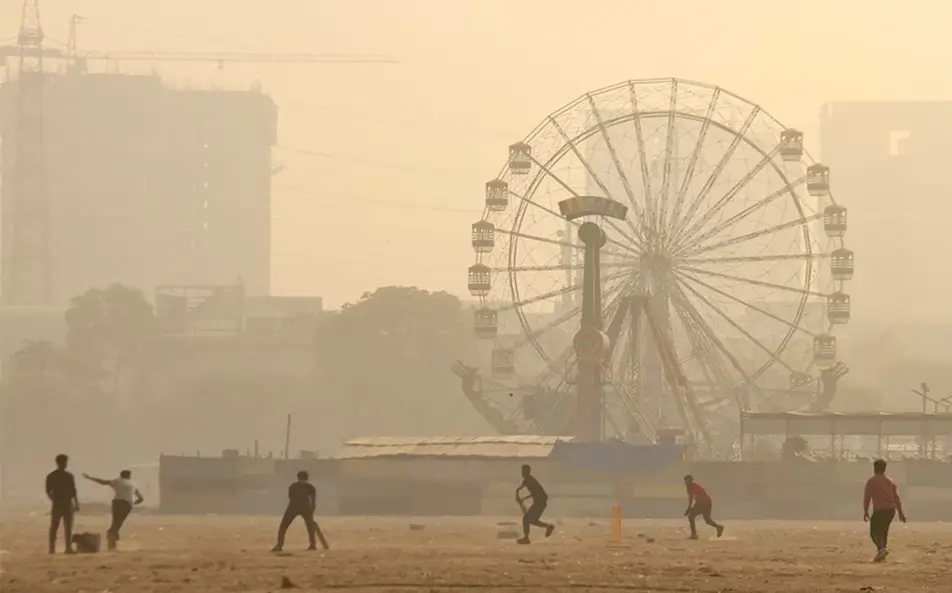
Delhi recorded an official air-quality index of 376 on November 8, 2026, its worst Diwali-day result since 2021. Yet the most alarming measurements came after that day's 4 pm bulletin, when firecracker smoke and stagnant conditions pushed fine-particle concentrations sharply higher overnight. Investigations now question whether subsequent official figures captured the intensity of those hours.
The Delhi air quality debate is about missing observations, not merely competing apps displaying different numbers. For anyone following Delhi AQI after Diwali, the crucial distinction is between the festival-day score of 376 and the readings issued on November 9, after the pollution surge.
On November 10, the Central Pollution Control Board (CPCB) explained that its automated validation system treats particulate-matter observations above 1,000 micrograms per cubic metre as outside the accepted range. Those hours are excluded from the relevant 24-hour calculations. The board argued that a daily index reflects prolonged exposure and that its scale cannot exceed 500.
The distinction is important. In an analysis of CPCB's hourly system, Hindustan Times found that PM2.5 readings of about 420 µg/m³ already reached the maximum hourly score of 500. Values of 450 and 999 therefore received the same top score. But observations exceeding the 1,000 threshold were not given 500; they were left out. The Delhi air pollution problem is not that an index has a ceiling. It is that excluding the worst hours can lower a station's reported average, even when a capped score could have represented those hours without expanding the scale.
Business Today identified 125 station-hours absent from the CPCB feed but available in records released by the Delhi Pollution Control Committee. All 125 corresponding measurements exceeded 1,000 µg/m³. At Mundka, a monitor recorded PM2.5 of 3,744 µg/m³ at 2 am on November 9. That was a pollutant concentration, not an AQI reading of 3,744.
A more extensive Hindustan Times reconstruction put Delhi's 9 am November 9 reading at 393 rather than the official 370 when excluded hours were counted at the index ceiling. For the 4 pm city bulletin, its estimate was 372 versus the published 344. An earlier partial reconstruction produced the smaller estimate of 384 for 9 am; the figures reflect different datasets, not contradictory official revisions.
The Delhi AQI dispute also involves station coverage. The investigation found that ten of 59 monitoring stations dropped out of the 9 am citywide calculation because too few valid hours remained. Twelve were excluded by 4 pm. That matters for Delhi air quality because several heavily affected locations were missing from the citywide average.
The Centre for Research on Energy and Clean Air examined 1,416 expected station-hour PM2.5 observations across 59 monitors for the 24 hours ending at 4 pm on November 9. It found 255 missing entries. Assuming each missing reading was 1,000 µg/m³ lifted the estimated average concentration from 269 to 400 µg/m³, or about 49%.
That 49% is a scenario-based change in PM2.5 concentration, not a measured jump in the official index. It does not establish the exact exposure at every station. Still, it adds weight to concerns about winter air pollution reporting when monitors encounter unusually high concentrations.
The city's official festival-day scores were 382 in 2021, 312 in 2022, 218 in 2023, 328 in 2024, 345 in 2025 and 376 in 2026. The 2023 low should not be described as a pandemic lockdown result. Weather, fireworks, regional emissions and other factors differ each year, limiting simple comparisons.
The Indian Express reported that Delhi's average PM2.5 concentration was 339.34 µg/m³ at 2 am on November 8, before the main evening fireworks. It later reached 584.2 µg/m³ at 1 am on November 9. These figures trace the overnight surge more accurately than comparing the single Diwali-day score with a subsequent night-time peak. Delhi NCR air pollution should also be assessed across surrounding districts, where different station coverage and weather can complicate comparisons. Private platforms may show figures above 500 because they apply other scales; those numbers are not directly comparable with India's national index.
CPCB says it is reviewing its older validation framework and continuing to upgrade monitoring technology. No revised method, implementation timetable or corrected official November 9 bulletin has been announced. The next test is whether future alerts clearly show missing hours and explain how excluded readings affect station coverage.
For residents searching Delhi AQI after Diwali, an official score in the Very Poor range already signals meaningful health risks. Yet transparent reporting matters: an AQI figure should not become less representative simply because conditions worsen beyond the accepted measurement range.
As winter air pollution intensifies, Delhi air pollution and Delhi NCR air pollution require monitoring that can communicate exceptional peaks as well as daily averages. Better disclosure would make Delhi's air-quality warnings more useful without pretending a single number captures everything people breathe.
Everything you need to know
CPCB said on November 10, 2026 that its particulate-matter analysers are calibrated to measure up to 1,000 µg/m³, and readings above that range do not contribute to the 24-hour average, according to Hindustan Times.
Under the National AQI formula, an hourly PM2.5 reading of about 420 µg/m³ already reaches the maximum score of 500, so readings of 450, 999, 1,001 and 3,744 µg/m³ all register the same 500 score, per Hindustan Times's analysis.
Delhi's reported Diwali-day AQI averaged 376 in 2026, the worst since 2021's 382, according to The New Indian Express. It was 345 in 2025, 328 in 2024, 218 in 2023 and 312 in 2022.



Nov 08, 2026
TUI Staff
Nov 05, 2026
TUI Staff
Nov 05, 2026
TUI Staff
Nov 04, 2026
TUI Staff
Nov 12, 2026
TUI Staff
Nov 11, 2026
TUI Staff
Nov 10, 2026
TUI Staff
Nov 10, 2026
TUI Staff

Stay informed with independent, fact-checked journalism on technology, environment, government, economy and more. India’s most trusted digital news platform.

Comments (0)
Be the first to comment!